As we celebrate IPv6 month and mark a decade of LACNIC IPv6 statistics, we would like to share a summary of the milestones, achievements, advances, and statistics of this protocol in our region.
Historic context
Ten years ago, in May 2014, LACNIC started a small project that continues to this day and shows no signs of stopping: we created the IPv6 statistics collector.
(Free access, no subscription required)
A statistics collector?
The collector is simply a python3 script that connects to Google Statistics [1], processes and cleans the data, and then stores it in our database. At LACNIC we use these numbers for a variety of purposes, including:
The collector is simply a python3 script that connects to Google Statistics [1], processes and cleans the data, and then stores it in our database. At LACNIC we use these numbers for a variety of purposes, including:
The numbers you will see in the following images represent IPv6 penetration rates among end users. For example, 30% means that out of every 100 people, 30 already have IPv6.
Let’s begin our journey
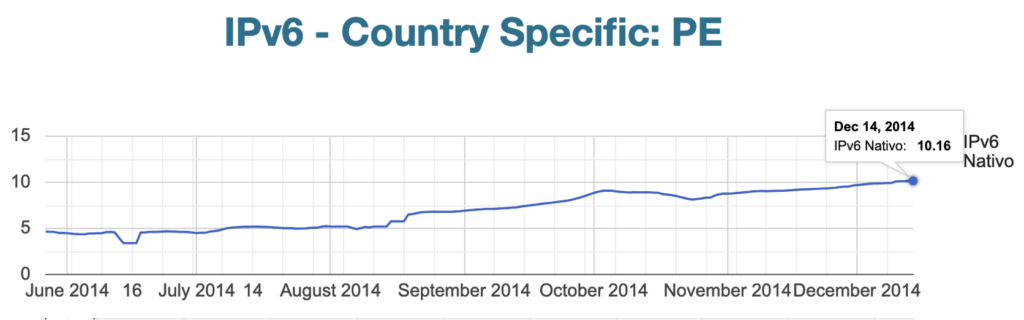
2014. We’ll start with the countries that were already embracing IPv6 in 2014. In other words, countries where there was already some IPv6 penetration (> 1%), such as Peru, where it was 4.6%, and Ecuador, which ended the year with a little over 1%. Even back then, we were already saying, “We need to follow the example of Ecuador and Peru.”
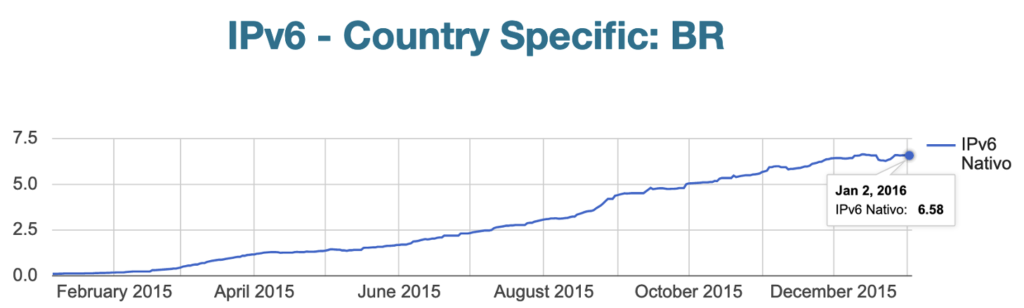
2015. The race for IPv6 adoption was now in full swing. In 2015, some countries began their own IPv6 journey, setting the stage for great results in subsequent years. Countries such as Bolivia and Brazil began their IPv6 deployment processes and ended the year with rates of 3% and 6% respectively, marking the start of their inspiring progress.
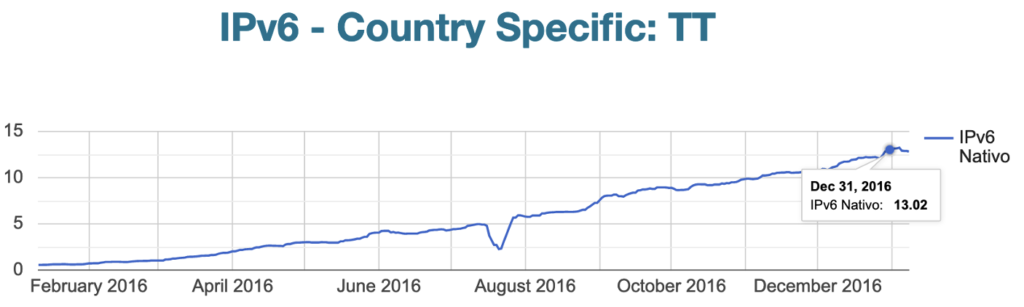
2016. In 2016, Argentina, Guatemala, and Trinidad and Tobago entered the race and managed to end the year with 1.93%, 1%, and 11% deployment rates, respectively. It should be noted that the countries that had pioneered the process did not put a stop to their IPv6 deployments. For example, Brazil ended the year with more than 10% and Ecuador with 18%, the highest IPv6 deployment rate for the year. Considering that Brazil has a population of 215 million, 10% was not bad at all :-)
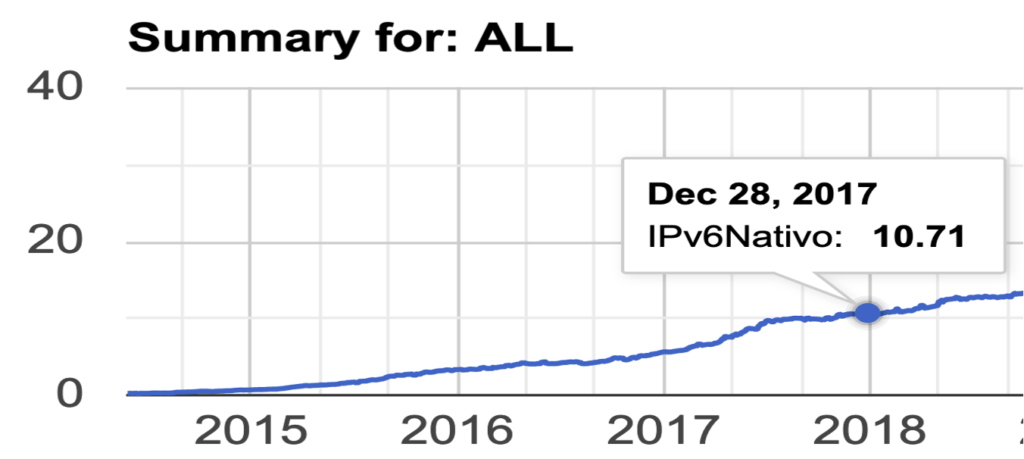
2017. The IPv6 party continued to grow. For example, Mexico reached a deployment rate of 4.5% and Uruguay an enviable 30%. The year ended with 10% of Latin Americans having access to IPv6. But the party was just getting started.
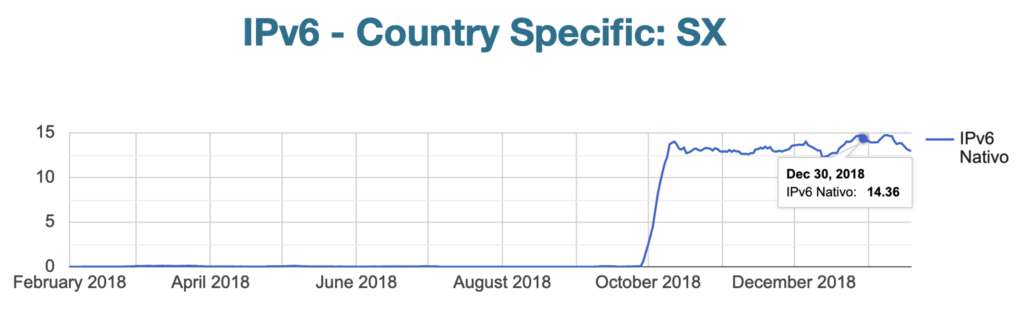
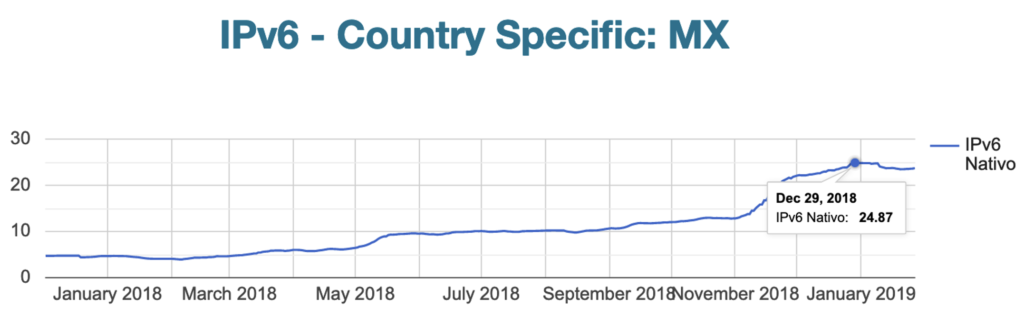
2018. The Caribbean took center stage, as three more countries made significant progress: Dominican Republic (1.2%), Sint Marteen (13%), and Belize (1%) all left their mark. Meanwhile, in Mexico the IPv6 adoption rate increased from 4% to 24%.
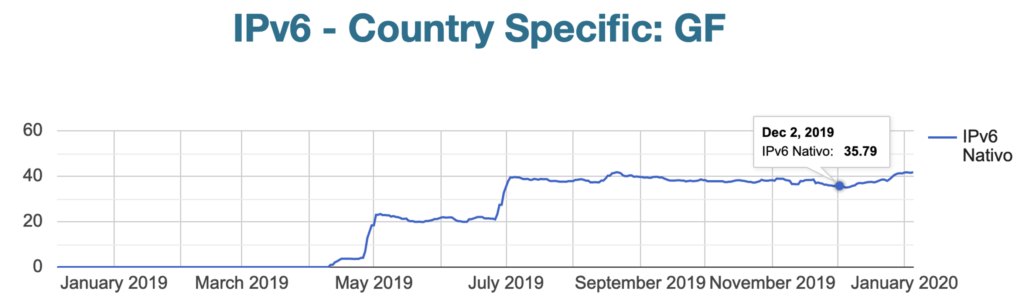
2019. The Caribbean showed its determination, with French Guyana making astonishing progress and reaching an IPv6 deployment rate of 37% in record time. Colombia and Paraguay also shone with 1.4% and 1.8% respectively. In addition, the rest of the region continued ahead, with Argentina reaching 8%; Bolivia, 15%; Brazil, 28%; Mexico, 31%; and Peru, 18%. All in all, the regional average reached 20%!
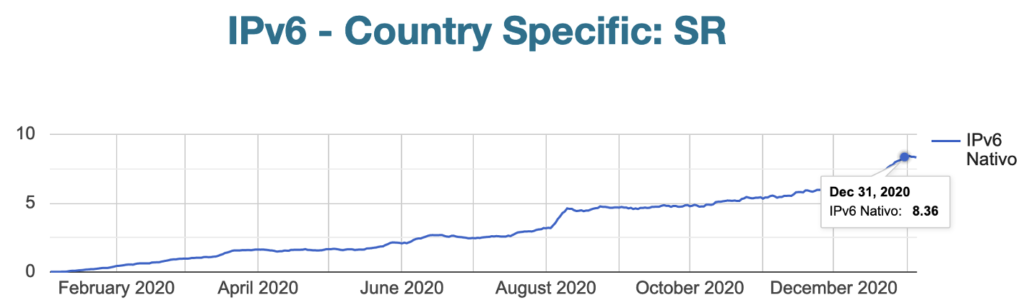
2020. The evolution of IPv6 did not stop. Chile and Suriname broke barriers, reaching 1.2% and 6.8% respectively. Nicaragua, Belize, Bolivia, and Paraguay also showed notable growth and exciting progress in IPv6 adoption.
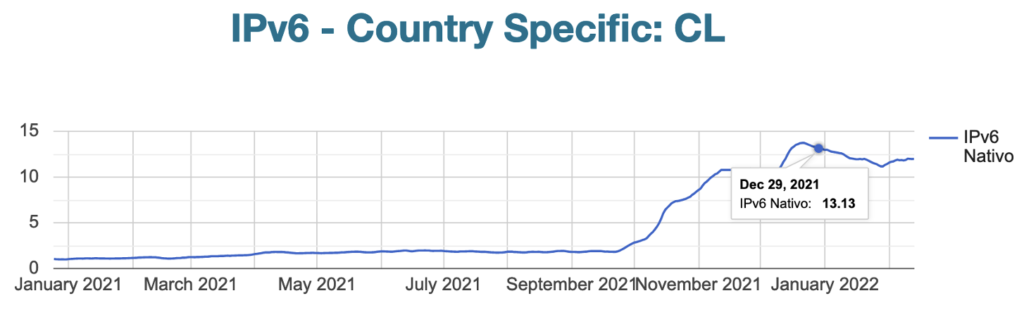
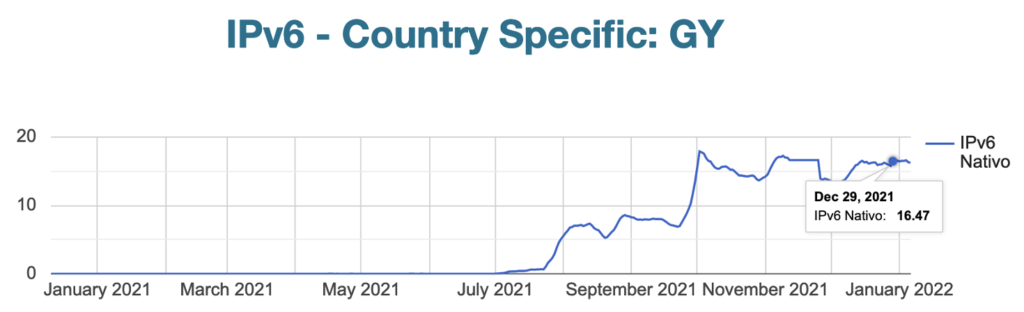
2021. Central America became the epicenter of IPv6 expansion, with El Salvador, Nicaragua, and Honduras reaching adoption rates of 13%, 18%, and 6% respectively. Guyana continued to grow, surpassing 16%. Chile also made significant progress, jumping from 1.1% to an 13%!
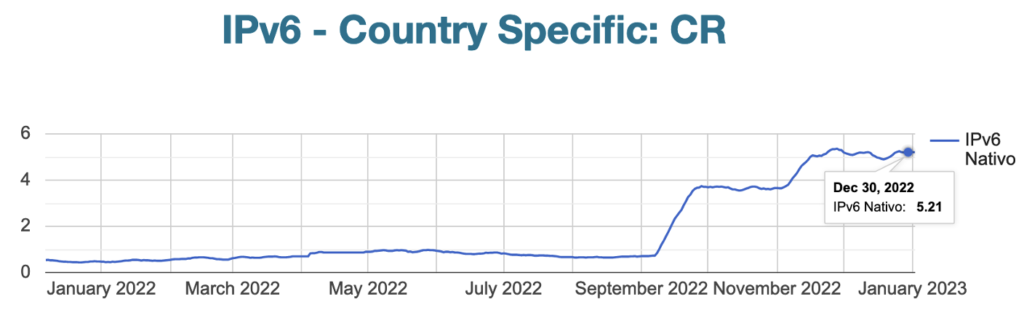
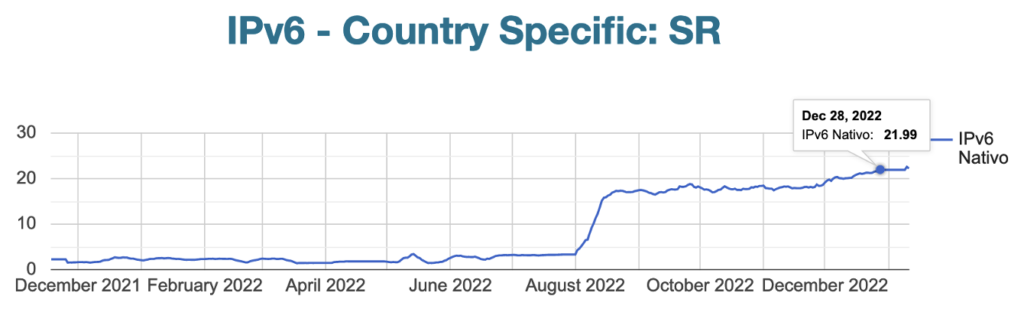
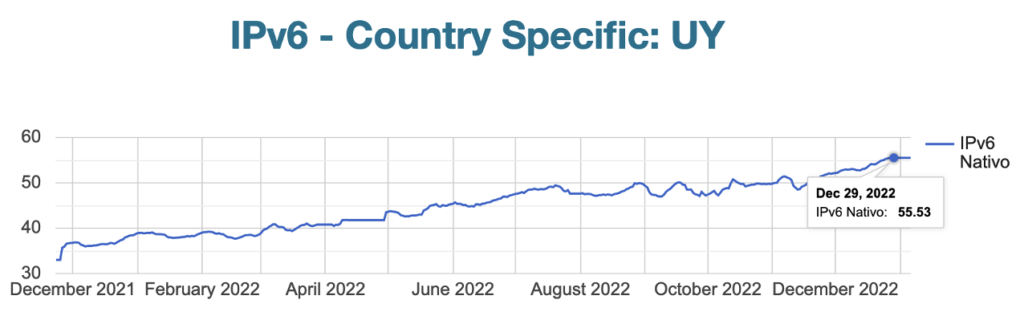
2022. In 2022, IPv6 fever appeared to be contagious. Costa Rica and Panama joined the party with 5% and 1.1%. Curaçao also joined the movement with 1%. Suriname stood out for its progress: from a conservative 3% to an impressive 21%. Uruguay broke the 50% barrier, marking a significant regional milestone.
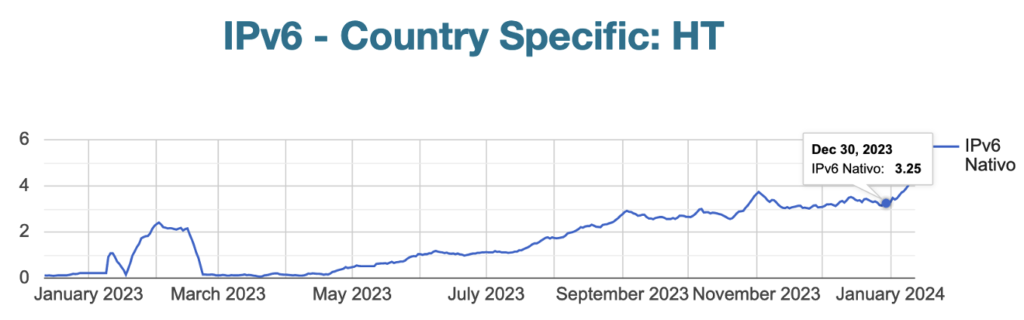
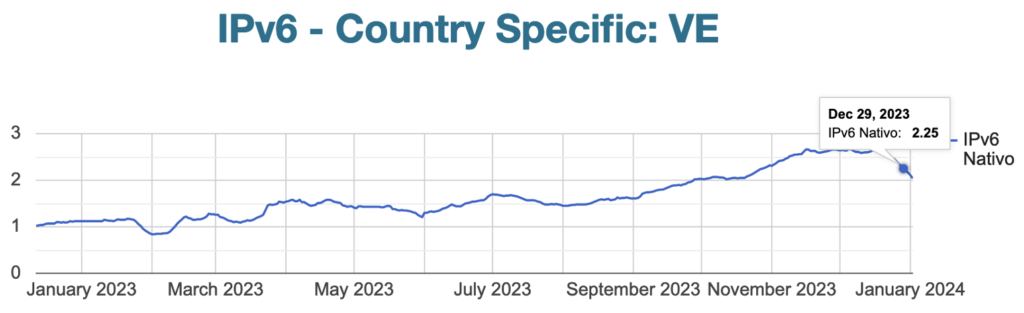
2023. IPv6 deployment continued to grow in Latin America and the Caribbean. Bonaire, Sint Eustatius, and Saba reached the 1% mark, while Haiti and Venezuela finished the year with a promising 3% and 2% respectively. In December 2023, 34% of our region had IPv6, a sign of notable progress in the adoption of the new protocol.
Conclusions
IPv6 adoption in Latin America and the Caribbean began in 2014, led by Peru and Ecuador. Over the following years, IPv6 adoption grew steadily across the region, including countries such as Mexico, Brazil, and Bolivia. The momentum continued in 2022, with Costa Rica, Panama, Argentina, and Chile achieving significant deployment rates. By the end of 2023, 34% of the region had adopted IPv6, marking a significant milestone on the road to a more advanced and accessible Internet in the region. It should also be noted that Uruguay is the only country where the IPv6 penetration rate among end users exceeds 50%.
To conclude, we shouldn’t forget that approximately 30% of the population is not connected to the Internet, and IPv6 is the right way to reach them.