Analysis of 7 BGP Variables in the Region during 2022
24/05/2023

By Alejandro Acosta, R&D Coordinator at LACNIC
Context of this analysis: a bit of history
The Internet is a dynamic environment in constant evolution, with changes occurring as quickly as minute by minute or even second by second. Routes change, autonomous systems change, and these constant changes make the Internet a more fun and interesting environment.
Many of us who regularly follow various mailing lists are probably familiar with a weekly email we receive on Fridays, the “Weekly Global IPv4 Routing Table Report,” produced by Phillips Smith of the Network Startup Research Center (NSRC). In fact, this email provides valuable data about BGP and the world of IPv4. At LACNIC we wondered what we could do with this information at our disposal. And the answer was: Let’s process it!
With this in mind, we developed a parser to extract different BGP variables from the LACNOG mailing list [1] for the purpose of building a historical record of these variables that would span several years. Armed with this information, a new question came to mind: How much did the BGP statistics change in our region during 2022? This article answers this question.
Data used for the analysis
The data used for this analysis was taken exclusively from the LACNOG mailing list (https://mail.lacnic.net/mailman/listinfo/lacnog), by filtering the emails with the subject “Weekly Global IPv4 Routing Table Report.”
Scope
This analysis specifically focuses on the LACNIC service region during the period from 1 January to 31 December 2022. It should be noted that the data pertains exclusively to IPv4.
We studied the following variables:
- Prefix being announced by LACNIC region ASes
- LACNIC Region origin ASes present in the Internet Routing Table
- LACNIC Region origin ASes announcing only one prefix
- LACNIC Region transit ASes present in the Internet Routing Table
- Number of LACNIC addresses announced to Internet
- LACNIC Deaggregation factor
- LACNIC Prefixes per ASN
Why these variables?
The variables listed above are considered the most significant, as they provide a snapshot of the state of BGP at a specific moment. By organizing these variables on a timeline, we can effectively track important changes in our region. In addition, many of the other variables mentioned in the weekly report are derived from the main variables by straightforward calculations.
Example of the processed data (taken from [2])
Summary of the data for the LACNIC region
——————————
Prefixes being announced by LACNIC Region ASes: 117404
Total LACNIC prefixes after maximum aggregation: 28499
LACNIC Deaggregation factor: 4.12
Prefixes being announced from the LACNIC address blocks: 116794
Unique aggregates announced from the LACNIC address blocks: 48887
LACNIC Region origin ASes present in the Internet Routing Table: 10986
LACNIC Prefixes per ASN: 10.63
LACNIC Region origin ASes announcing only one prefix: 2672
LACNIC Region transit ASes present in the Internet Routing Table: 2278
Average LACNIC Region AS path length visible: 4.9
Max LACNIC Region AS path length visible: 55
Number of LACNIC region 32-bit ASNs visible in the Routing Table: 8784
Number of LACNIC addresses announced to Internet: 176436224
Equivalent to 10 /8s, 132 /16s and 52 /24s
LACNIC AS Blocks 26592-26623, 27648-28671, 52224-53247, 61440-61951, 64099-64197, 262144-273820 + ERX transfers
LACNIC Address Blocks 177/8, 179/8, 181/8, 186/8, 187/8, 189/8, 190/8, 191/8, 200/8, 201/8,
Data processing
The data was processed entirely using Python3 on Linux. The beautifulsoup [3] library was particularly useful for scraping the mailing list. The graphs were generated using the Google Charts API.
Findings
- Prefixes being announced by LACNIC Region ASes
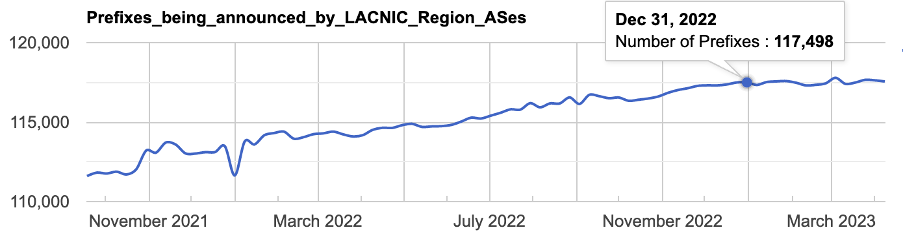
This indicator represents the number of prefixes announced to the Internet by autonomous systems in the LACNIC region. The graph shows a slight but constant growth: 5,857 more prefixes were announced —a 5% increase— over a period of 364 days (111,641 prefixes on 1 January vs 117,498 on 31 December 2022).
- LACNIC Region origin ASes present in the Internet Routing Table
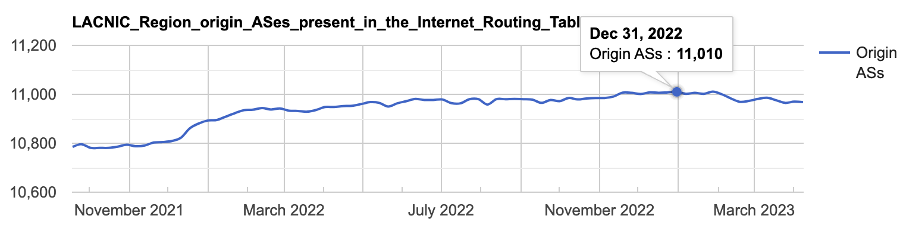
This indicator represents the number of autonomous systems assigned by LACNIC that are visible in the global Internet routing table (Default Free Zone, DFZ). This graph is quite constant and shows a very slight growth: 117 more autonomous systems —a 1% increase— over a period of 364 days (10,893 on 1 January vs 11,010 on 31 December 2022).
- LACNIC Region origin ASes announcing only one prefix
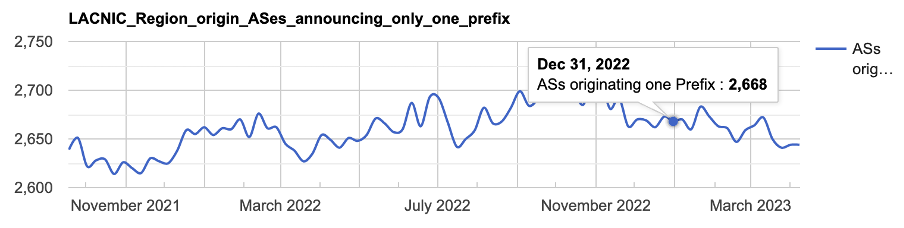
This variable represents the number of autonomous systems assigned by LACNIC that announce only one prefix to the global Internet routing table (Default Free Zone, DFZ). Despite appearing sinusoidal, the variations in this graph are not very significant, as can be seen by looking at the scale on the Y axis. The variable representing the number of autonomous systems assigned by LACNIC that announce only one prefix to the global Internet routing table remained highly stable. Starting from 2,662 ASes on 1 January, the count rose to 2,668 by 31 December, a minimal increase of 6 ASes that resulted in a growth rate of 0.2% over a period of 364 days.
- LACNIC Region transit ASes present in the Internet Routing Table
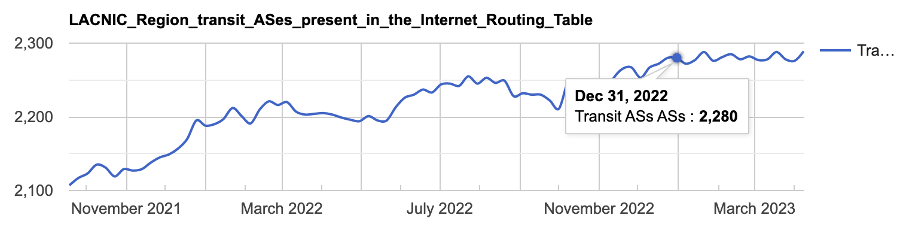
This interesting variable represents the number of autonomous systems in the LACNIC region that provide transit to other ASes. Over a span of 364 days starting on 1 January and ending on 31 December 2022, this variable experienced a growth of 4.2%, with 92 additional LACNIC region ASes providing transit to other ASes, the count rising from 2,188 to 2,280.
- Number of LACNIC addresses announced to Internet
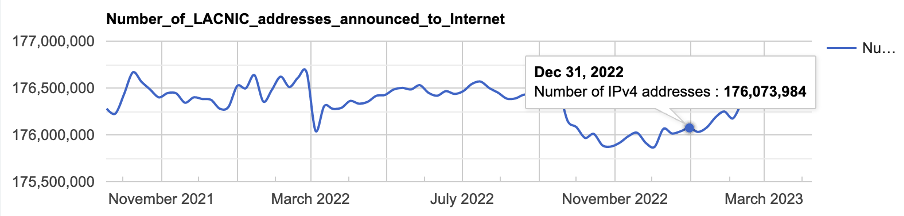
This variable represents the number of unique IPv4 addresses assigned by LACNIC that are visible in the global routing table (Default Free Zone, DFZ). The number of visible IPv4 addresses decreased by 0.3% or 447488 addresses. On 1 January 2022, there were 176,521,472 visible addresses; by 31 December, this number was down to 176,073,984.
- LACNIC Deaggregation factor
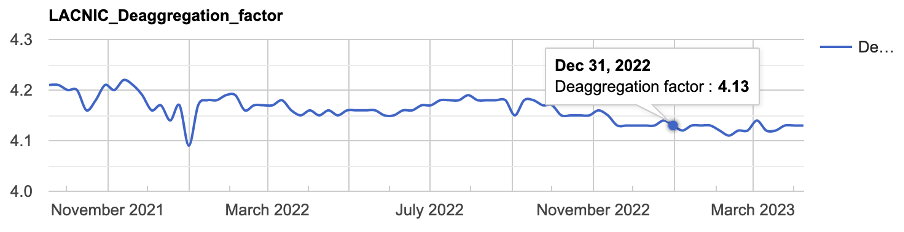
The deaggregation factor may sound complicated but should also be taken into account. This is a typical case where less is more. Having started the year with a deaggregation factor of 4.09, the LACNIC region reached 31 December 2022 with a deaggregation factor of 4.13. This means that there was an increase of 0.04. A higher deaggregation factor means that more specific prefixes are being announced for the destination/parent address, and this can allow greater granularity and more precise routing decisions. However, a higher deaggregation factor can also increase processing power and memory requirements for routers. Ideally, in this case, network operators should carefully review their announcements to avoid making unnecessary announcements, for example, by minimizing subnetting in the announcement.
To illustrate the impact, let’s consider the case of a network with 10,000 announcements and a deaggregation factor of 4. If this network were able to reduce its deaggregation factor to 1, it would be left with only 2,500 announcements.
- LACNIC Prefixes per ASN
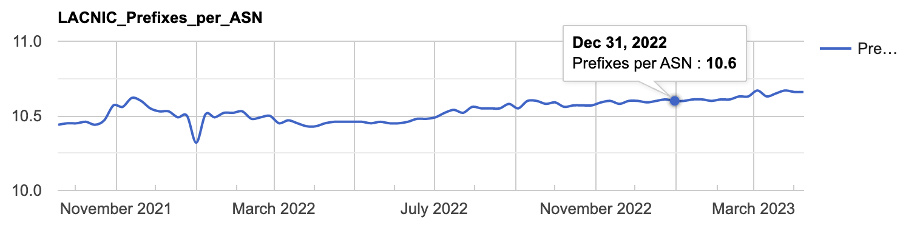
This represents the average number of prefixes per autonomous system in the LACNIC region, a variable that showed no major variations throughout the year. The average number of prefixes per autonomous system grew by 0.48%, increasing from 10.32 to 10.8.
Conclusions:
The main findings are presented below:
- During 2022, a constant growth of 5% was observed in the number of prefixes being announced to the Internet by autonomous systems in the LACNIC region (111,641 vs 117,498).
- The number of autonomous systems assigned by LACNIC that are visible in the global Internet routing table remained constant, with a slight increase of 1%. During the year, these ASes increased by 117, growing from 10,893 to 11,010.
- Stability in the LACNIC region origin ASes announcing only one prefix. The number of autonomous systems assigned by LACNIC that announce only one prefix on the global Internet routing table remained relatively stable throughout the year, increasing by 0.2% (from 2,662 to 2,668).
- The number of autonomous systems that provide transit to other autonomous systems grew by 4.2%. During the year, the number of LACNIC ASes that provide transit grew by 92, going from 2,188 to 2,280.
- As for the number of IP addresses visible in the DFZ and considering that these are not prefixes but IP numbers, it might be said that it remained stable, as the decrease was negligible. Perhaps the main finding is that these addresses have not increased despite IPv4 exhaustion, which suggests that no new blocks have started to be announced.
- The deaggregation factor remained almost unchanged, but in the end, there was a minor increase. As mentioned earlier, this is not beneficial to the Internet ecosystem.
References:
[1] https://mail.lacnic.net/mailman/listinfo/lacnog
[2] https://mail.lacnic.net/pipermail/lacnog/2023-March/009429.html
[3] https://pypi.org/project/beautifulsoup4/
[4] https://stats.labs.lacnic.net/BGP/ParserWeeklyBGPUpdate/ParserWeeklyBGPUpdate.html
[5} Github, WeeklyParserForBGPStats: https://github.com/LACNIC/WeeklyParserForBGPStats